The FI$Cal system is so big, so complex that it can be difficult to grasp everything it does, especially over a long period of time. The numbers, such as $2 trillion in annual banking transactions or 20 terabytes of data, are simply too vast.
Organizations sometimes like to divide these kinds of numbers into an average week or day in an effort to promote understanding. At FI$Cal, we’ve gone a step further and come up with a graphic that breaks down the system’s activity into a typical hour.
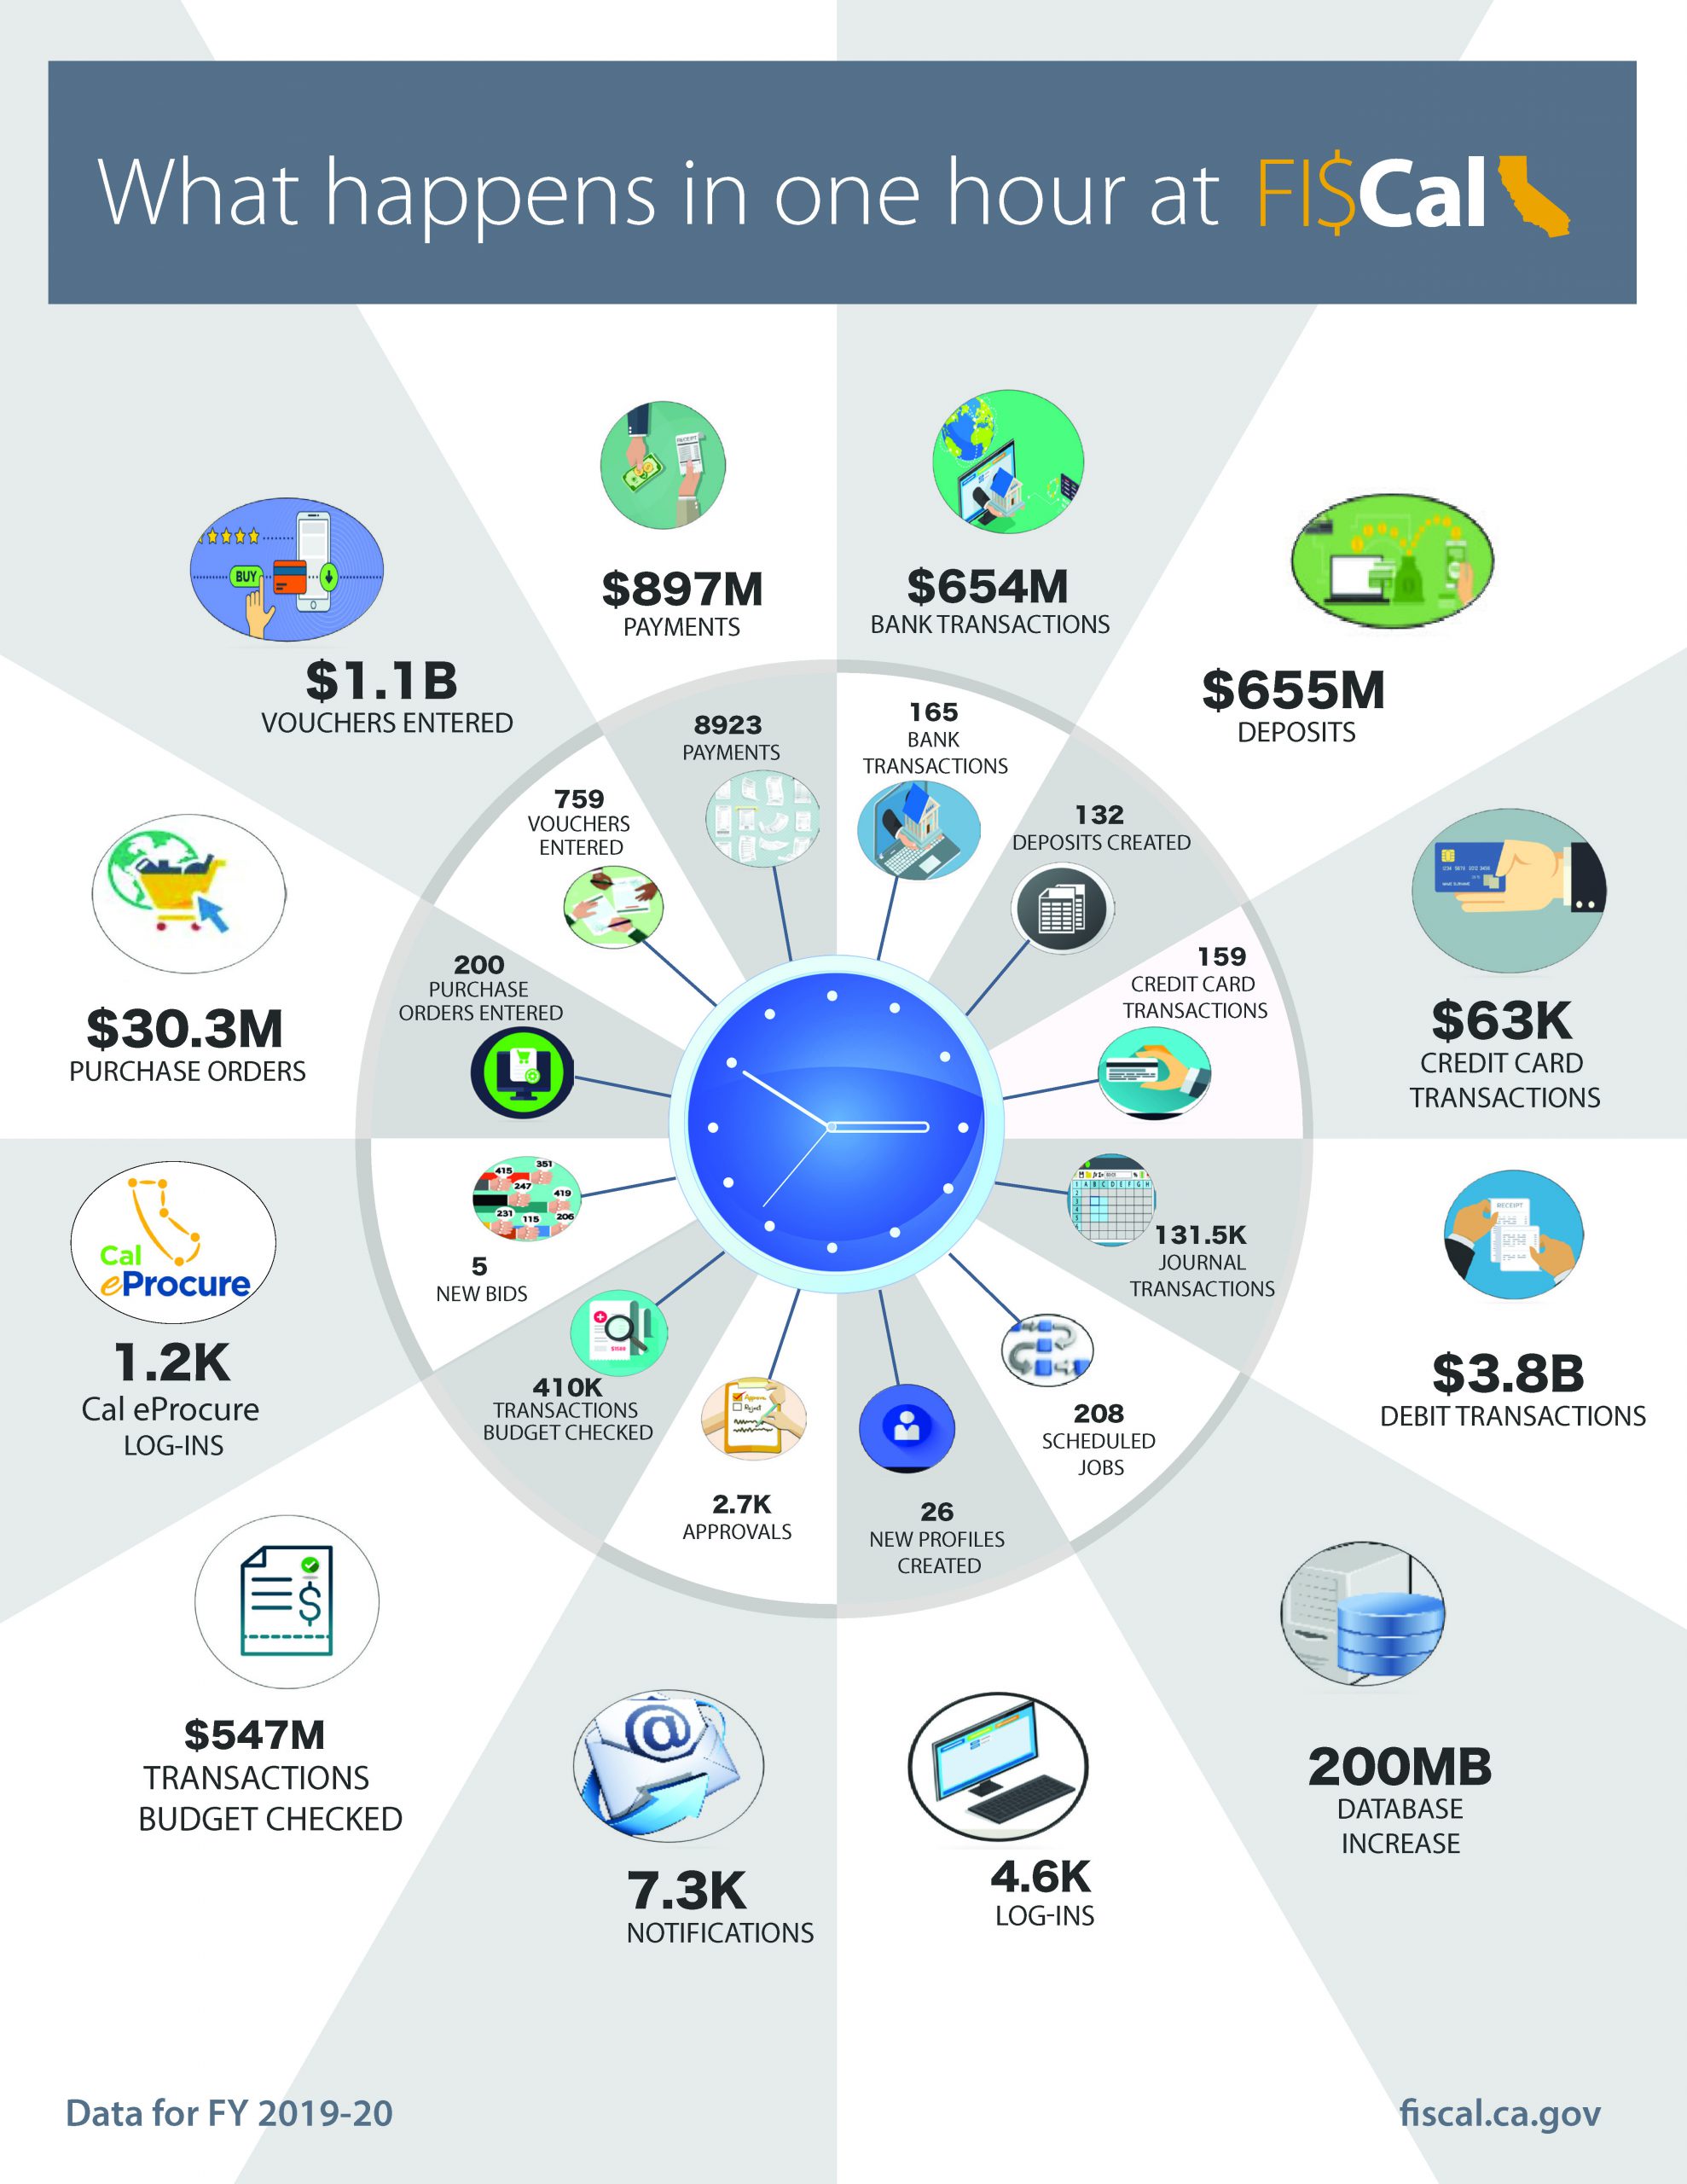
The chart illustrates what a workhorse the FI$Cal system is on behalf of California’s state finances. With every passing hour, the various purchase and bank transactions, log-ins, profile creations and more keep on ticking. Whether you’re talking about approvals, vouchers or transaction budget checking, everything involving 152 state departments’ accounting, budgeting, procurement and cash management is done in the FI$Cal system.
Take a look at the clock and marvel at the volume of work done in FI$Cal.